back to index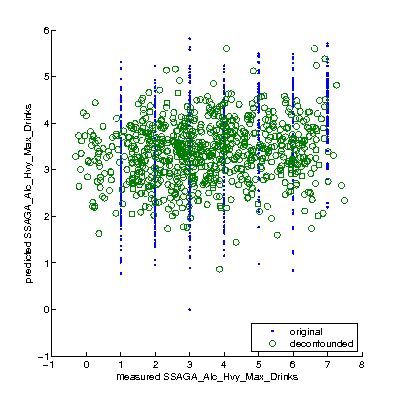
Correlation/prediction results for subject measure 148 (SSAGA_Alc_Hvy_Max_Drinks)
774 subjects had a valid SSAGA_Alc_Hvy_Max_Drinks measure.
Multivariate prediction (GLM-based, automatic feature selection, leave-one-family-out prediction)
Original data space: r=0.40 CoD=0.13 Deconfounded space: r=0.13 CoD=-0.03
Scatterplot shows predicted-SSAGA_Alc_Hvy_Max_Drinks vs measured-SSAGA_Alc_Hvy_Max_Drinks (in original and deconfounded data space).
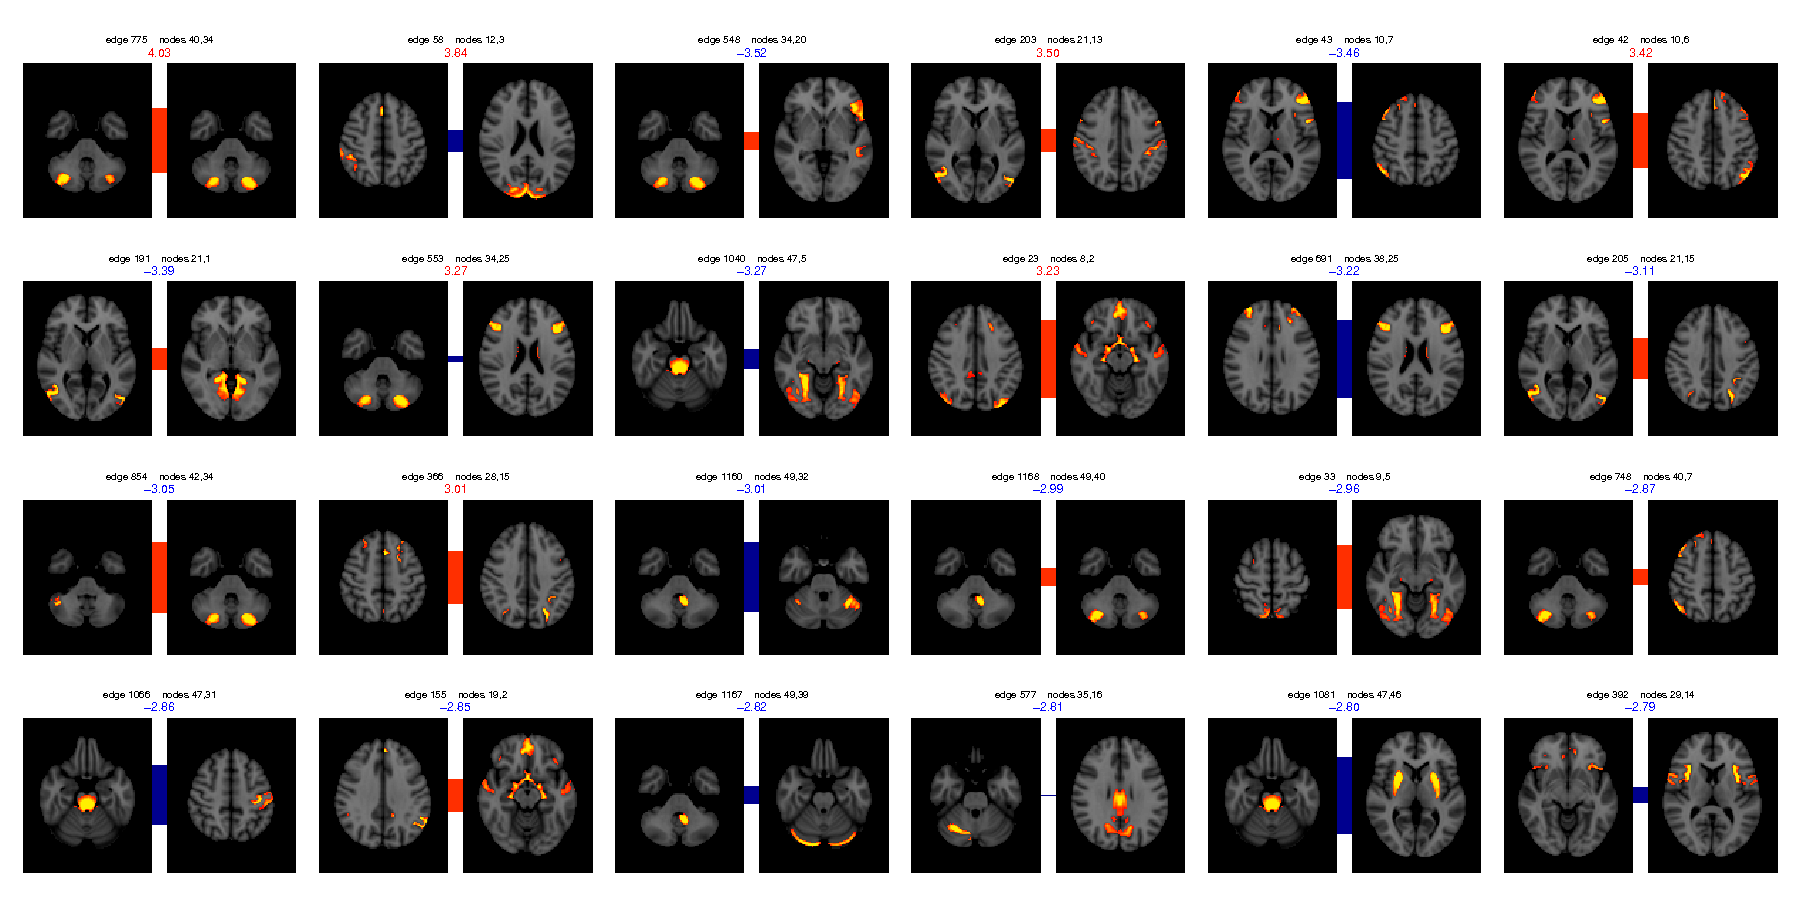
Univariate regression (regressing each netmat element independently against SSAGA_Alc_Hvy_Max_Drinks, correcting for multiple comparisons across elements, using PALM permutation testing, taking into account family structure).
Number of significantly correlated edges at p<0.05 (two-tailed, FWE corrected) = 0 (minimum corrected p = 0.1624)
Number of significantly correlated edges at p<0.05 (two-tailed, uncorrected) = 107 (62 expected by chance)
Image shows edges (node-pairs) whose connection most strongly correlates with SSAGA_Alc_Hvy_Max_Drinks (in decreasing order), with t-statistic listed at the top of each node-pair.