back to index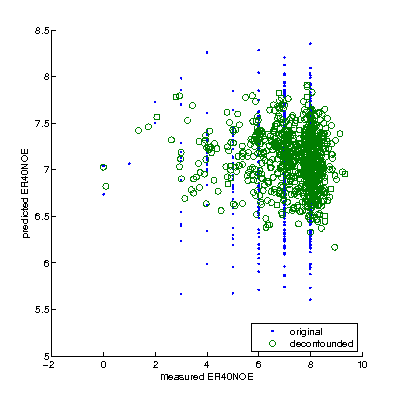
Correlation/prediction results for subject measure 246 (ER40NOE)
816 subjects had a valid ER40NOE measure.
Multivariate prediction (GLM-based, automatic feature selection, leave-one-family-out prediction)
Original data space: r=-0.03 CoD=-0.18 Deconfounded space: r=-0.10 CoD=-0.10
Scatterplot shows predicted-ER40NOE vs measured-ER40NOE (in original and deconfounded data space).
Univariate regression (regressing each netmat element independently against ER40NOE, correcting for multiple comparisons across elements, using PALM permutation testing, taking into account family structure).
Number of significantly correlated edges at p<0.05 (two-tailed, FWE corrected) = 0 (minimum corrected p = 0.4396)
Number of significantly correlated edges at p<0.05 (two-tailed, uncorrected) = 47 (62 expected by chance)
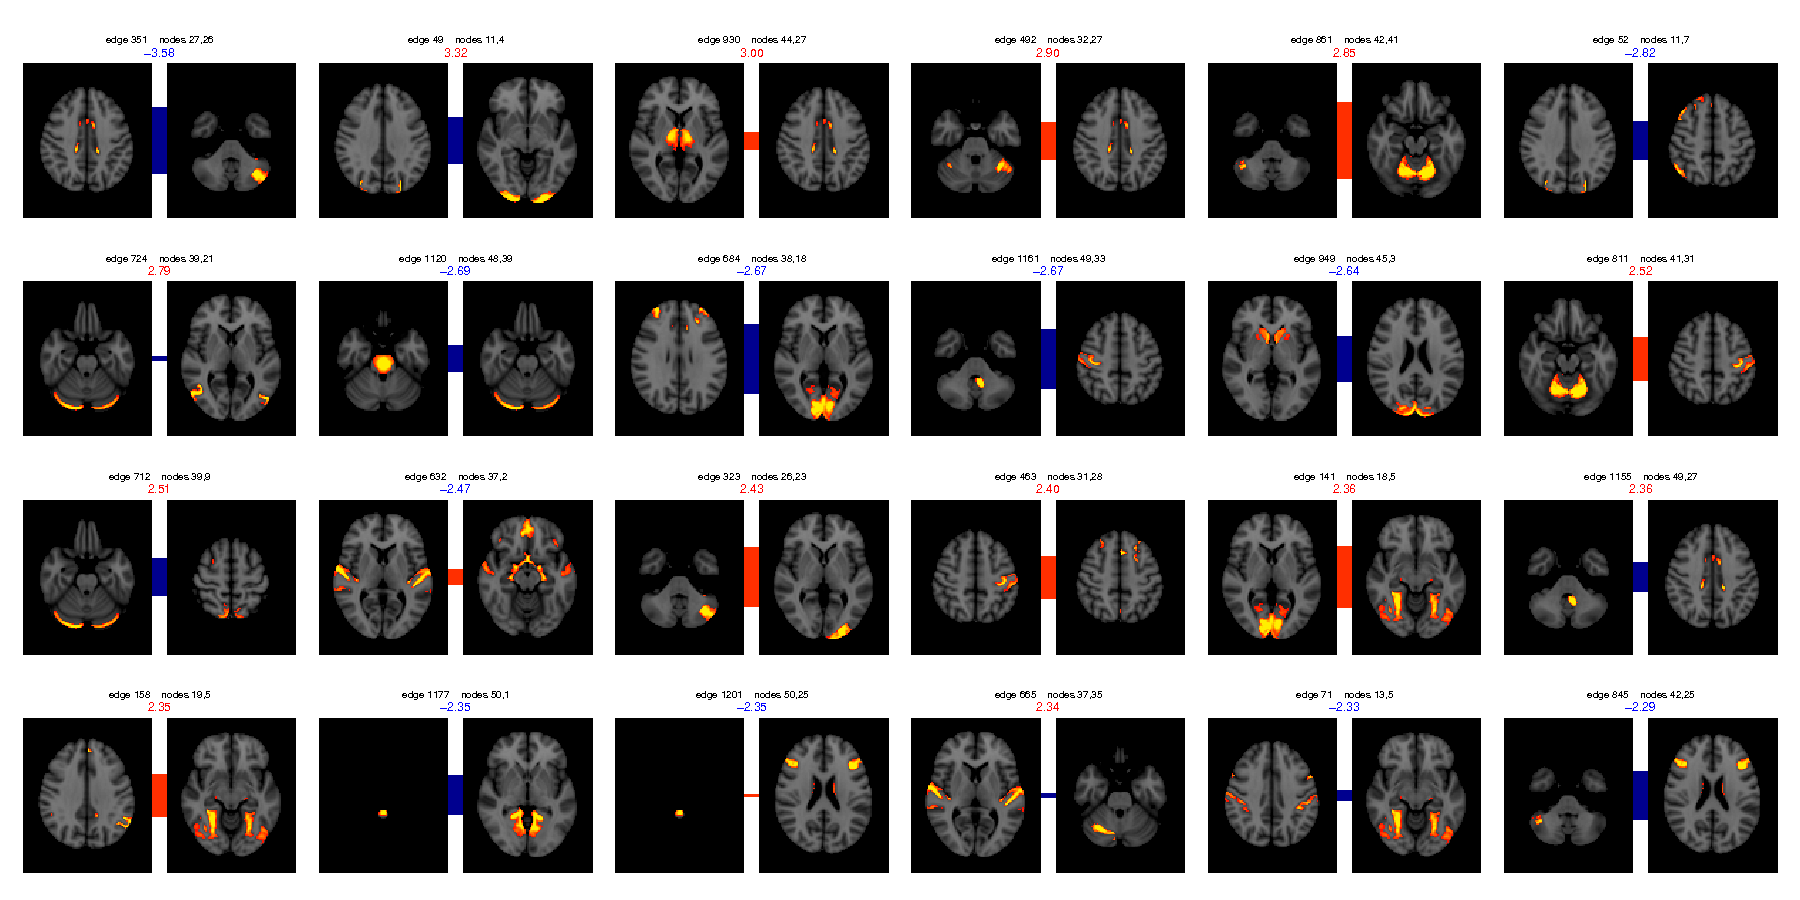
Image shows edges (node-pairs) whose connection most strongly correlates with ER40NOE (in decreasing order), with t-statistic listed at the top of each node-pair.